Tutorial
Searching the database
Currently, you can search using the gene Id (if you know) or any probably function for a gene. As an example, searching for the keyword “auxin” will result in 325 table entries having auxin as a keyword in their function. The resultant table will show the accession, chromosome number, Gene ID, Gene Ontology (GO), start and end position, and the DNA strand. Links have been provided in the table to view the fasta sequence of that particular gene, to view the gene in JBrowse2, and to view the dashboard summarizing the statistics of BLAST results of that gene with other wheat varieties (from a pan-genomic perspective). This dashboard provides various statistical information derived from the BLAST of T. monococcum genes against the other wheat varieties. The statistics provided here include the length of gene sequence, number of germplasm matched along with the individual genomes, length matched, scores etc.
JBrowse2
Previously released Jbrowse1 (Buels et al., 2016; Skinner, Uzilov, Stein, Mungall, & Holmes, 2009) had some limitations like only one genome would be displayed and needed more support for new software libraries. Here, we have used the linear genome viewer of JBrowse2 to show the genome assemblies. All the assemblies can be accessed by individual chromosomes. Gene model annotations were linked to each of the assemblies which include gene structure and putative function for both high-confidence and low-confidence genes models (if available). Moreover, the recent release of JBrowse2 supports viewing synteny between multiple genomes. We have precomputed synteny between every possible pair of genomes and uploaded in JBrowse2.
How to view the linear synteny in JBrowse2
Linear synteny has been provided between available genomes in the browser. Steps to view the linear synteny is as follows:
1. From the JBrowse2 home page click on Empty link (highlighted).

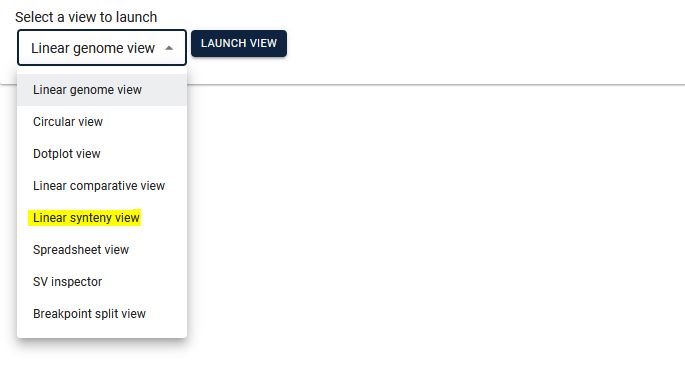
2. Select Linear synteny view from the dropdown menu and click ‘Launch view’.
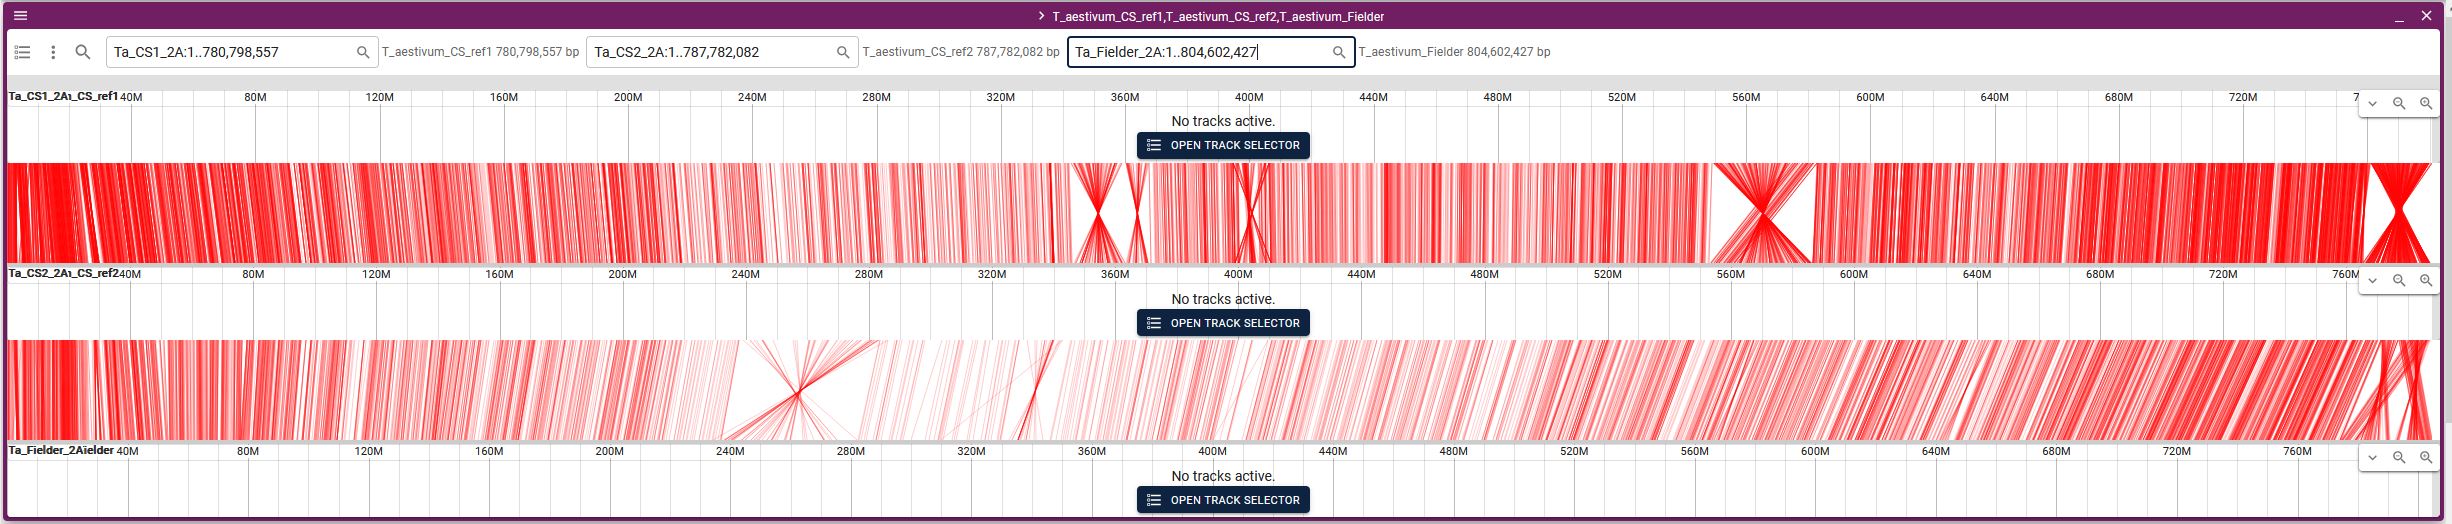
3. Select the two species for which you want to see synteny, then by selecting the existing track option, automatically the respective file will be displayed. Here if you only want to see the two genomes, click "LAUNCH" button (GOTO step 4). In case you want to see synteny between more than 2 genomes click the "ADD ROW" button and then from the dropdown menu select the genome. You can add any number of genomes, however, loading a higher number of genomes will be slower. Make sure to click the arrowhead between each genome pair to confirm that the respective collinearity file has been loaded.

4. From the chromosome dropdown menus, select the respective chromosomes (it will be best to choose the same chromosome number from all the genomes). Please note that initially all the chromosomes will be displayed and it may take a couple of minutes to show all the connections.
SequenceServer2
Sequenceserver is a tool that provide BLAST facility. In this database, we have taken care of pan-genomic perspective of large genome and provided group wise BLAST databases. For example, if a user wants to do a BLAST search against only A genome of all the wheat varieties, he/she can select ‘Group A’ and easily do the search.
Kablammo
Kablammo accepts BLAST result output files in XML format and will illustrate exactly which portions of the query sequence mapped to which portions of the subject sequence. Kablammo takes an XML file as an input (which can be downloaded from SequenceServer output) and provides an interactive figure for each subject matched. The query as well as subject sequences can be zoomed-out or zoomed-in for better results viewing experience. Other features like image export, alignment viewer, and exporter are also available.
Synteny
In the present database, we have provided pre-computed synteny results for all the possilbe combinations for 38 wheat varieties (~600). These results can be downloaded by selecting the relevant varieties from the dropdown menus on the left side of the synteny tab on the webpage. AccuSyn (Jorge Núñez et al., 2020) is interactive software that shows circular syntenic plots of chromosomes and draws links between similar blocks of genes using Simulated Annealing to minimize link crossings. This tool requires two input files viz. an annotation file (.gff) and an alignment file generated from McScanX (Y. P. Wang et al., 2012). We have therefore provided the input files (GFF and collinearity files) to be uploaded into AccuSyn. Users can download these zipped files for different wheat varieties. Then they need to extract and upload the two files to the Accusyn website, for which a link has been provided on the same tab. AccuSyn displays synteny between genomes by circularly displaying chromosomes. A user can select one or more chromosomes as required. An interactive figure on the right displays the blocks that were matched between the chromosomes. It should be noted that the same input files can be used as input in SynVisio (https://synvisio.github.io) which can display synteny in a linear fashion which is useful for viewing a few chromosomes at a time.

Statistics
This page diaplays all the basic statistics about all the genomes present in the database. A couple of filters on the left allow the user to view the statistics from selections like based on ploidy or even individual genomes. A user can also download the data through the tables.

Generate Stats
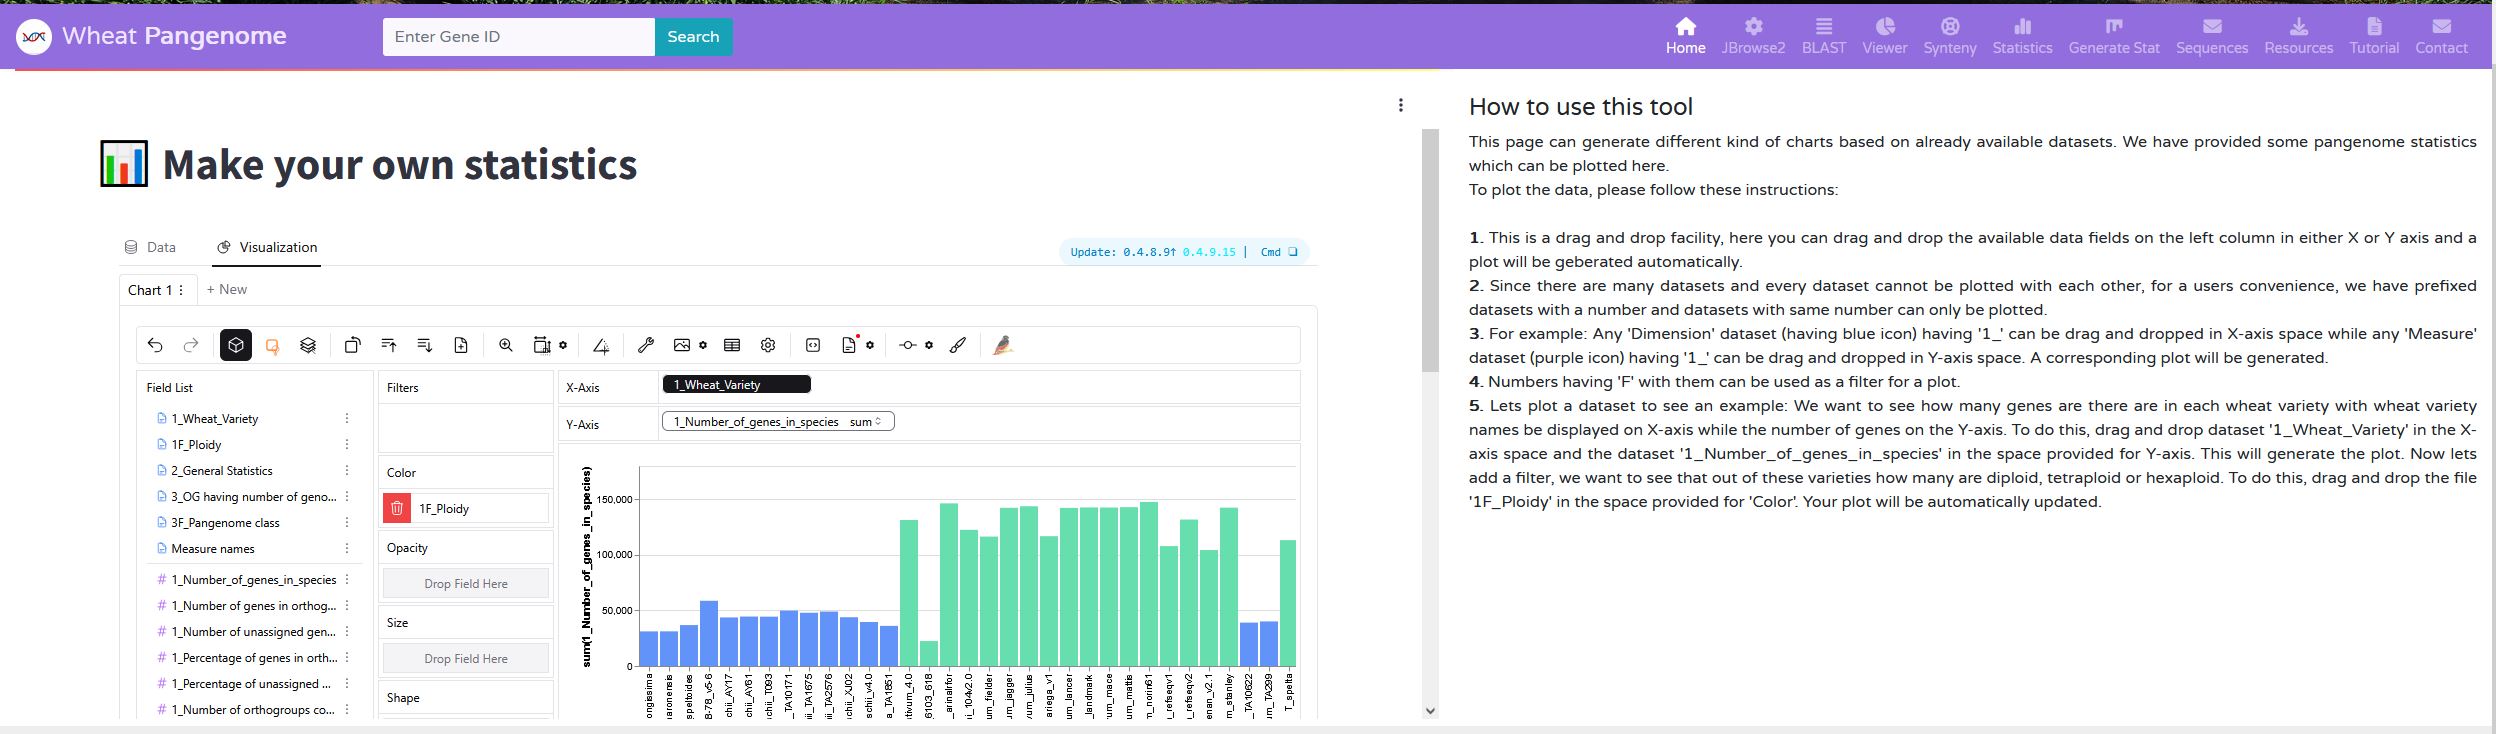
A user may want to generate some custom plots. We have provided this functionality by creating a dashboard with drag and drop function. Here a user can drag some already provided files and make their own plots. A step wise procedure have been provided on the same page for ease of access.
Sequences
This functionality will help a user to extract all the orthologous sequences from the pangenome. A user has to select the assembly and chromosome and by clicking on the "Fetch Gene IDs" button will list all the gene Ids for that chromosome. Then the user can select any gene id and click "Fetch Sequences" that will fetch all the orthologous sequences from the pangenome and display them in Jalview (unaligned). A user can download these sequences and use in any analyis (for eg. multiple sequence analysis).

View BLAST Results
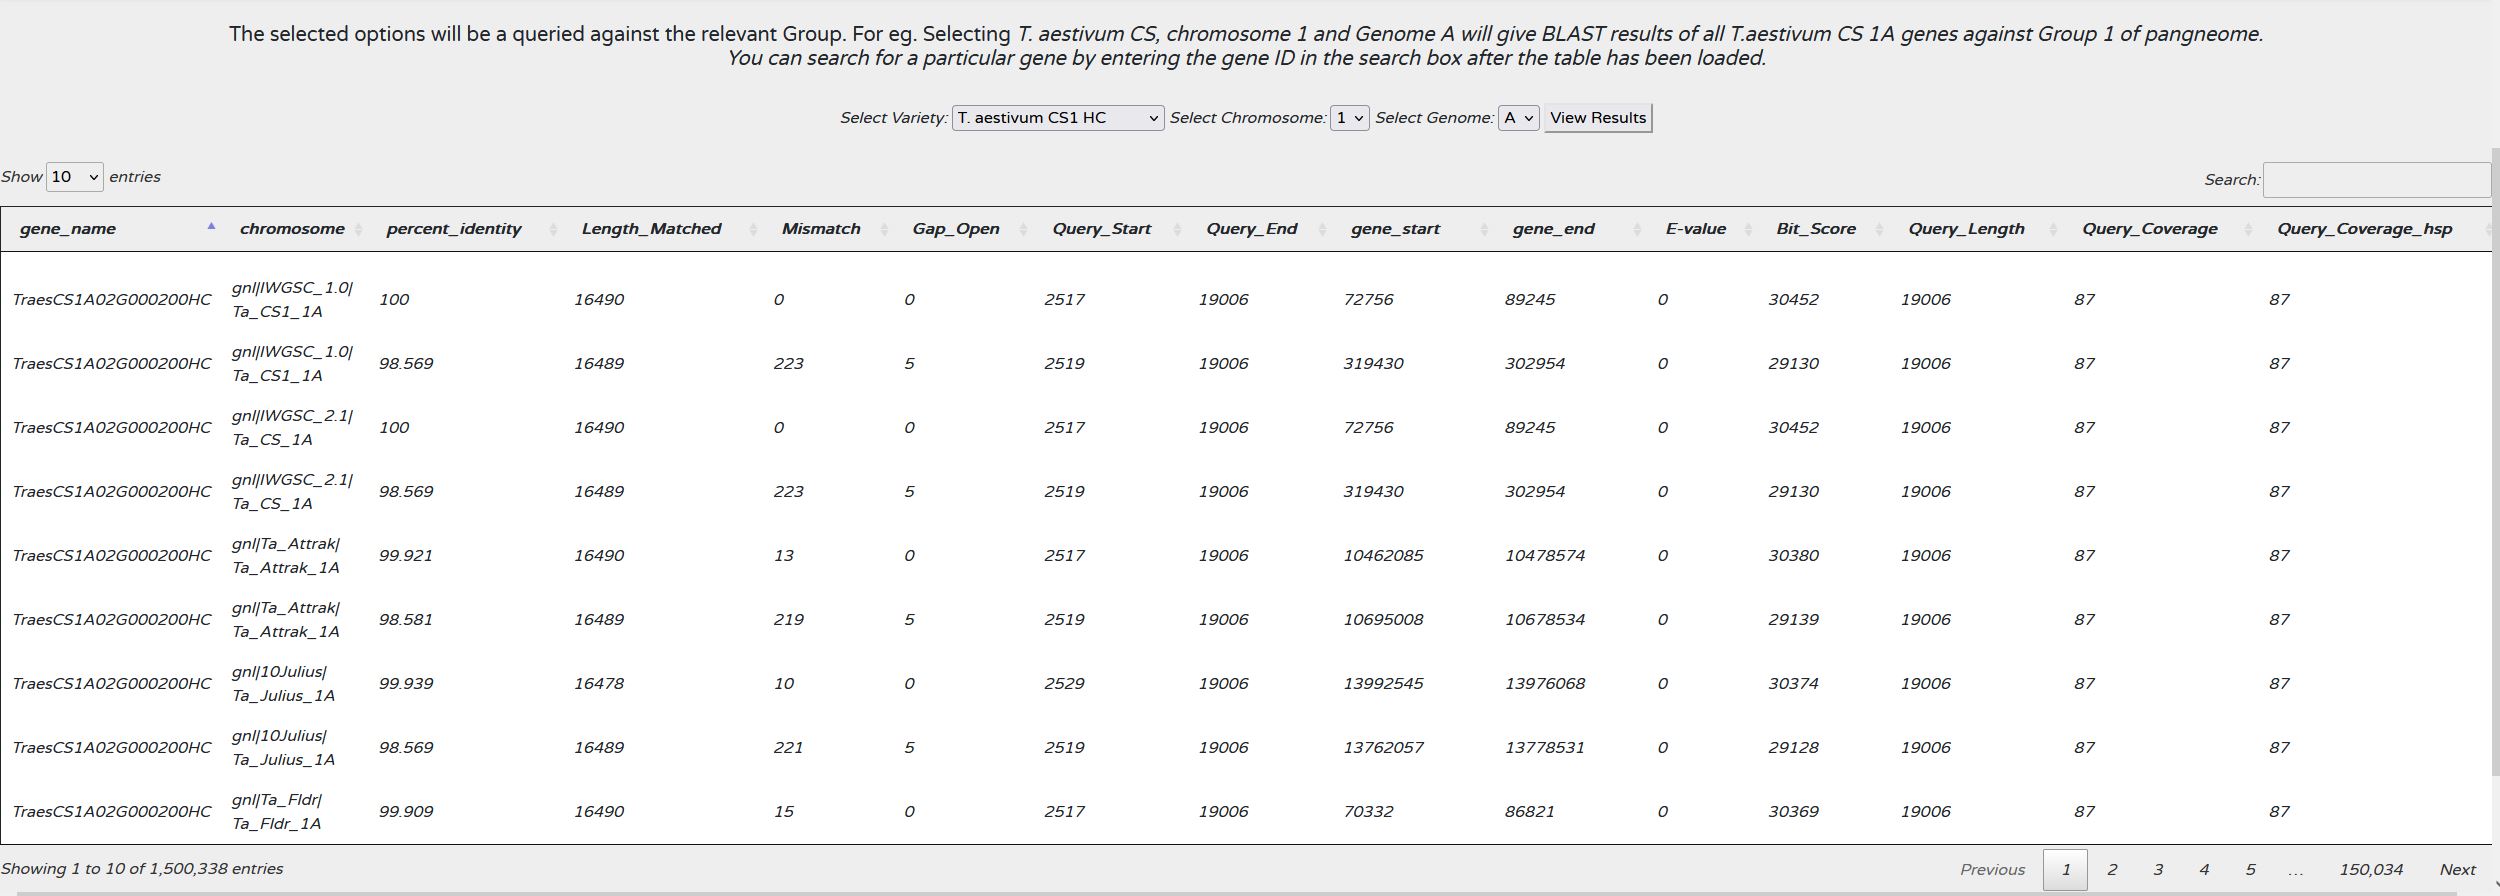
The orthologous sequences were identified using a BLAST search of a gene against the pangenome. Here. if have shown all the respective BLAST results in a tabular fashion. A user can select the respective genome and chromosome and all the BLAST results for all the genes on that chromosome will be diaplayed. A user can also search for any particular gene id or any term for the seach box given on the top right of the table.
View Figures
Viewing large tables could be confusing. Images are more informative. So here we have tried to look at the orthologous genes with respect to their postions in different genomes. A user can select any assembly with their respective chromosome. A list of genes will be displayed and the user can select any gene id which in turn will display a plot with all the orthologous genes. This is an interactive plot and the user can zoom in at any location and see the details (position, length etc.).
